By Philip Newman
As the MTA faces an uncertain future, subway ridership has hit its highest point since 1965.
The Center for an Urban Future said the growth was primarily outside Manhattan — including Queens, where ridership rose more than 28 percent from 1998 to 2008.
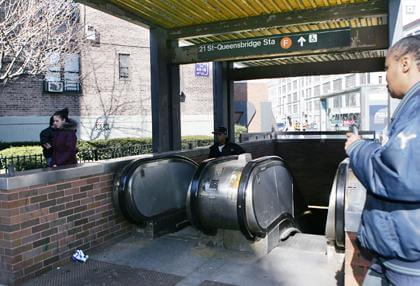
The F line 21st Street−Queensbridge subway station experienced the most growth in Queens, up 253.1 percent and second only to the Lexington line station at 63rd Street in Manhattan, with a 777.2 percent increase.
The CUF, a think tank devoted to city affairs, said 20 of the 22 citywide stations with the highest percentage of increase in riders were either in the outer boroughs or in Manhattan north of 96th Street.
The agency said much of the growth produced higher totals than anytime since 1965, and in some cases, 1951.
“Our analysis, based on data from the New York City Transit Authority, show just how important the city’s public transportation system has become for residents living outside the city center,” the CUF said.
The number of straphangers increased sharply at many Queens subway stations.
The 21st−Queensbridge station was followed by 45th Road−Court House Square (No. 7), up 188.8 percent; Willets Point−Shea Stadium (No. 7) , up 124.3 percent; 23 Street−Ely Avenue, on the E and V line, up 79 percent; Beach 36th Street (A line), up 70.2 percent; Beach 44th Street (A), up 66.9 percent; 39th Avenue (N, W), up 64.3 percent;
Vernon Boulevard−Jackson Avenue (No. 7), up 62.5 percent; Hunters Point Avenue (No. 7), up 60.6 percent; Grand Avenue−Newtown (G, R, V), up 60.2 percent; Woodhaven Boulevard (Jâ„Z), up 55.4 percent; Sutphin Boulevard−Archer Avenue (E, Jâ„Z), up 53.1 percent; 111th Street (No. 7), up 48.9 percent; 103 Street−Corona Plaza (No. 7), up 48.7 percent; 21st Street (G), up 47.7 percent;
Beach 67th Street (A), up 43.7 percent; Elmhurst Avenue (G, R, V), up 40.9 percent; Rockaway Boulevard (A), up 39.3 percent; 74th Street−Broadway (No. 7) Jackson Hts. (E, F, R, V, G) 38.4 percent; 33rd−Rawson Streets (No. 7), up 39 percent; 85th Street−Forest Parkway (J), up 37.9 percent; 61st Street−Woodside (No. 7), up 37.9 percent;
Astoria Boulevard (N, W), up 37.6 percent; Northern Boulevard (G, R, V), up 36.8 percent; 80th Street (A), up 34.3 percent; 75th Street (Jâ„Z), up 33.9 percent; Junction Boulevard (No. 7), up 31.2 percent; 36th Avenue (N, W), up 30.3 percent; 111th Street (J), up 30.1 percent;
Fresh Pond Road (M), up 29.7 percent; 121st Street (Jâ„Z), up 29.3 percent; Beach 60th Street (A), up 29 percent; 65th Street (G, R, V), up 28.7 percent; Broad Channel (A, S), up 28.5 percent; 104th Street (Jâ„Z), up 28.5 percent; 88th Street (A), up 28 percent; 46th Street (G, R, V), up 27.8 percent;
Queensboro Plaza (N, W, Z), up 27.7 percent; Far Rockaway−Mott Avenue (A), up 27.6 percent; Broadway (N, W), up 26.6 percent; Seneca Avenue (M), up 25.3 percent; Forest Avenue (M), up 25 percent; 46th−Bliss Streets (No. 7), up 23.8 percent; and Flushing−Main Street (No. 7), up 23.7 percent.
Reach contributing writer Philip Newman by e−mail at news@timesledger.com or phone at 718−229−0300, Ext. 136.